We’ve updated the Regulation section of SGD gene pages. You can now see how many regulatory relationships a gene has without leaving the page, and open the full details in one click.
What’s new
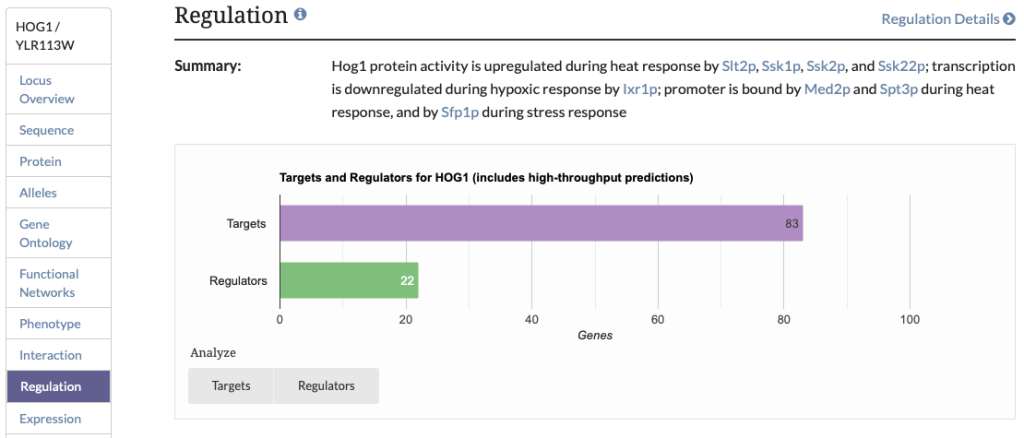
The Regulation section of each locus page now has a horizontal bar graph with two bars:
-
Regulators: the number of putative genes that regulate the locus.
-
Targets: the number of putative genes the locus regulates.
The counts are based on experimental evidence, including data generated by high-throughput techniques.
For example, the HOG1 Regulation section currently shows 83 Targets and 22 Regulators. The bars show at a glance whether a gene is mainly regulated, mainly regulates other genes, or both.
Explore the details
Click the graphic or the Regulation Details link to open the gene’s full Regulation page. It includes:
-
All regulation annotations. The Regulators table lists putative regulators, including experiments showing that a regulator binds the gene’s promoter or affects its transcription when the regulator is mutated. Each annotation gives the experiment and assay type, conditions, strains, and a reference. Data from Northern blot, EMSA, kinase assays, microarray, RNA-seq, and ChIP assays, etc., are included.
-
A regulator/target network showing the locus with its Regulators and Targets.
Each table has tools for working with the data:
-
Sort and filter. Sort by any column, or filter by keyword (for example, “microarray”) to narrow the table to a specific experiment type.
-
Download. Save the table as a .txt file.
-
Analyze. Send a list of genes to tools such as GO Term Finder, GO Slim Mapper, and SPELL for further analysis.
Why it matters
Regulation data come from many sources, so the amount of information varies widely between genes. The graphic shows how much regulatory evidence exists for a gene. The details page then lets you look at that evidence and export gene lists for downstream analysis.
This builds on SGD’s ongoing work on regulation data, including the updated regulation curation model described in DATABASE(2018).
Try it out
Go to any gene page, such as HOG1, scroll to Regulation, and click the graphic or Regulation Details. For help interpreting the data, see the Regulation Help page.
Questions or suggestions? Contact us!