A previous post talked about GO Subsets (Slims). If you’ve ever wanted a visual summary of gene functions (or biological processes/cellular components), try out the GO Ribbon. You can also find this ribbon throughout Alliance pages including the GO, Disease, and Expression data.
The color gradient of each high level term (slim) varies from white to deep blue for increasing values. By default the color gradient informs on the number of available annotations for each high level term. A toggle allows to change the color gradient to inform instead on the number of distinct terms, giving a better approximate of the diversity of functions for the gene in that branch of the ontology.
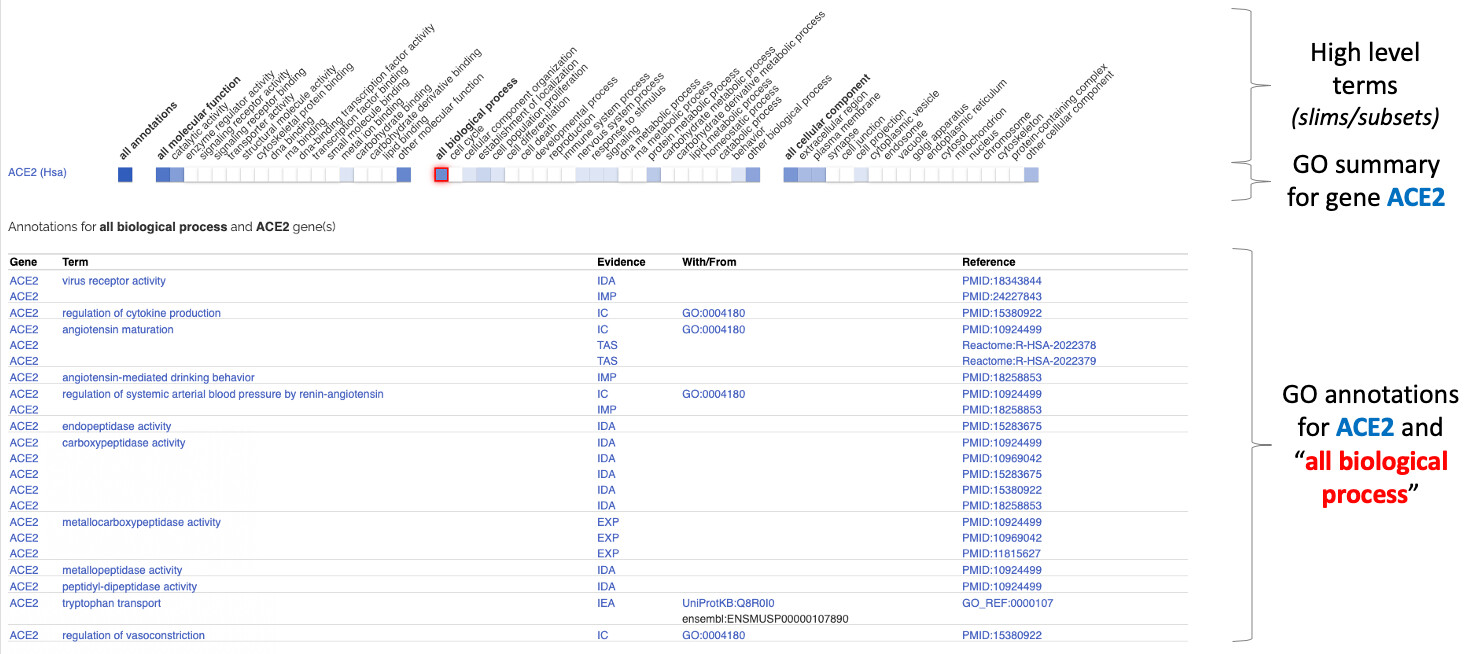
To further investigate the GO annotations grouped by a high level term, colored cells are clickable and will display the associated table of annotations as shown below:
Try our GO Ribbon Sandbox on your own genes, or read the full Ribbon doc on the GO website.
Note that the GO Ribbon is designed to provide a visual summary and a simpler way to navigate GO annotations. For gene sets, the GO Ribbon will show the functions shared between genes, but it will not inform on the statistical relevance (over / under representation) of such functions in the gene set. Statistical significance and bias of biological functions have to be examined through over representation tests and enrichment analysis.