If you have a list of genes, you can use tools like GO Term Finder (Princeton | SGD) and GO Slim (Term) Mapper (Princeton | SGD). But what if you just have a set of GO IDs?
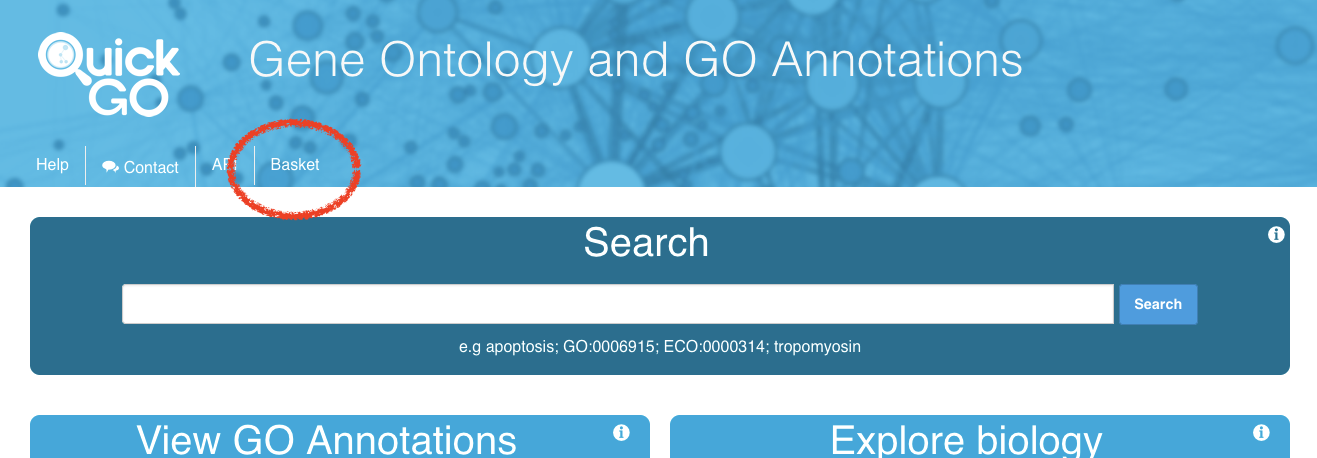
You can use the QuickGO browser from EBI and their Basket feature lets you view an ancestor chart with all your terms.
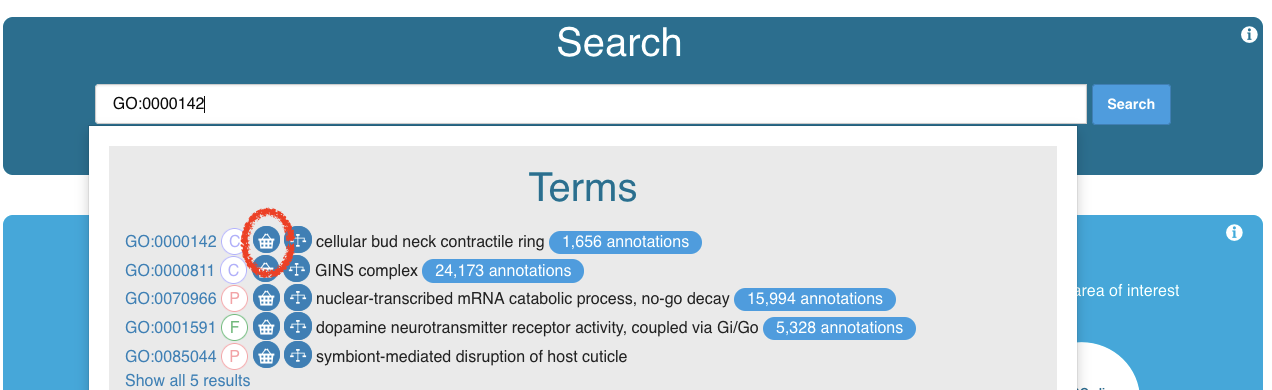
Add terms to your basket by selecting terms when browsing though the ontology.
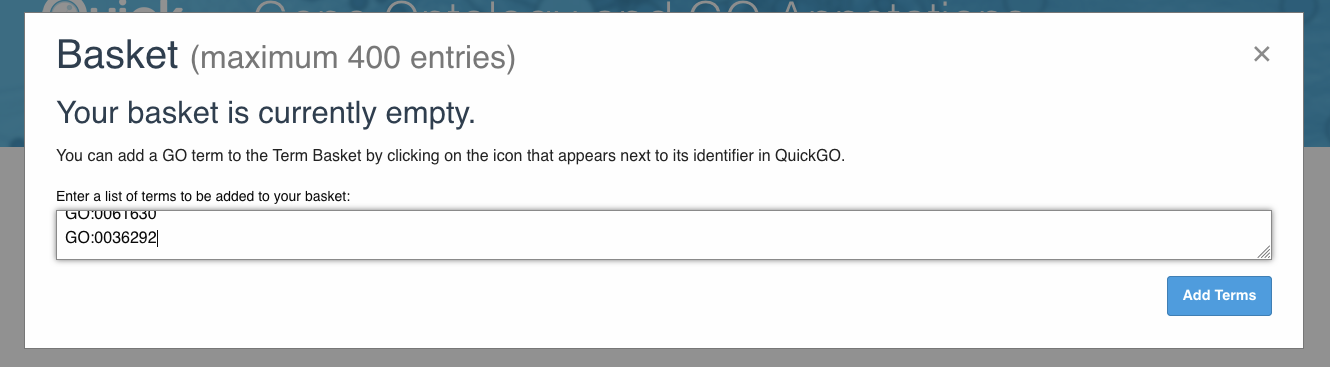
Or you can add your terms directly.
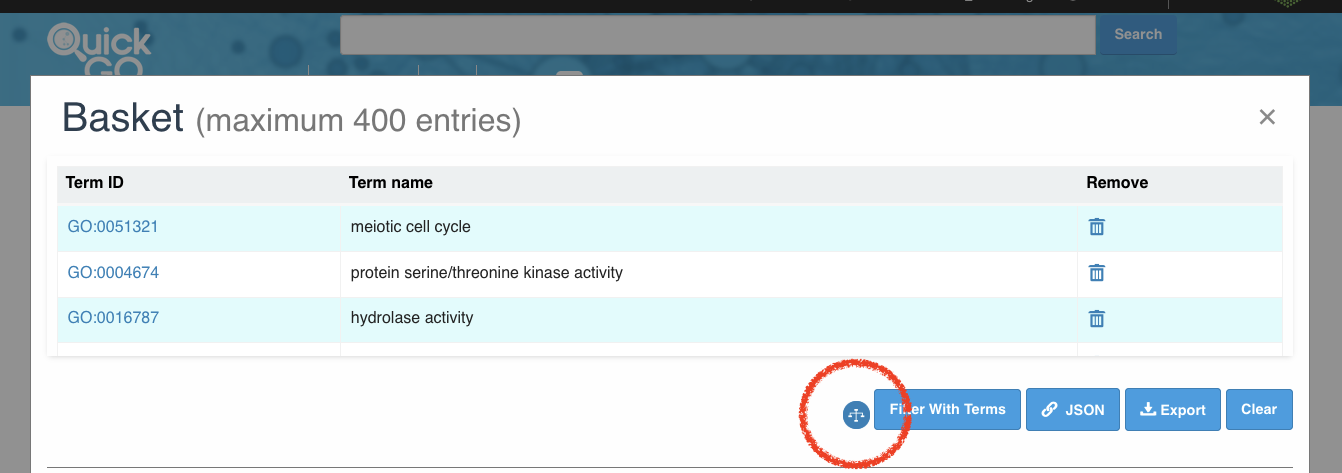
When you have all your terms added, select the ancestor chart button in your basket.
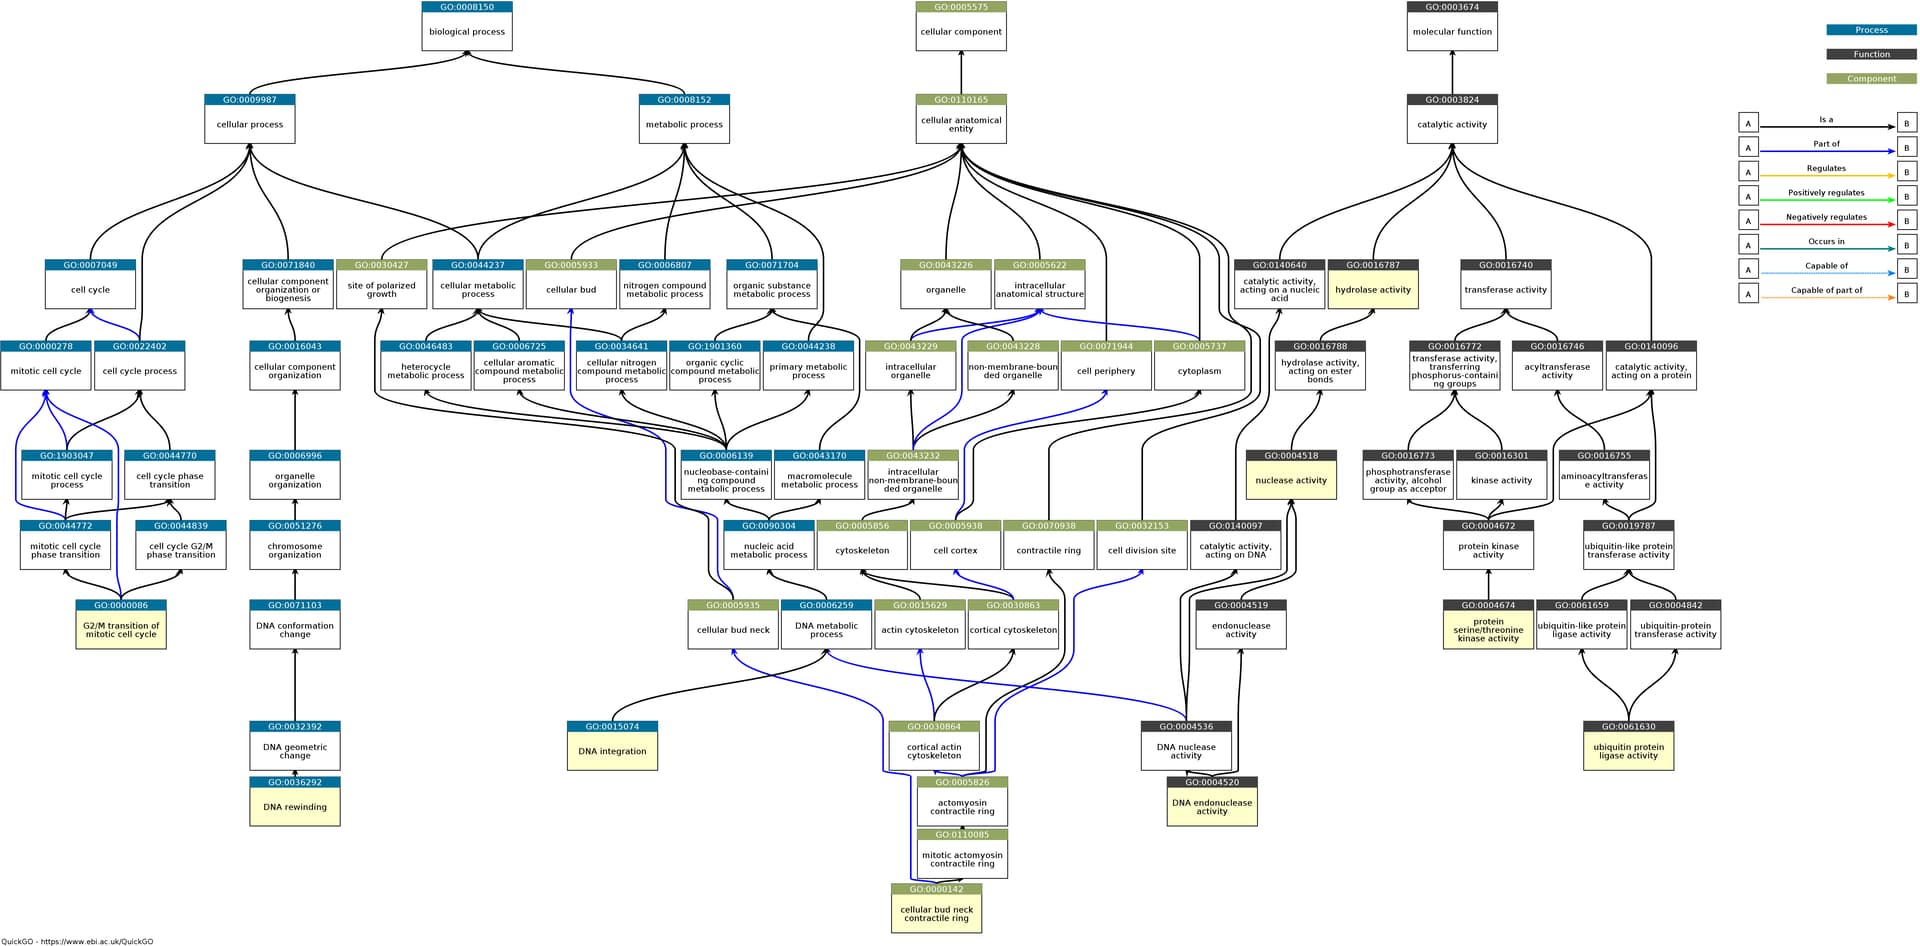
On the resulting ancestor chart, you can choose to display Slims, display child terms, and change the size of the boxes/font. If you use a chart like this remember to cite both GO (for the underlying data) and EMBL-EBI for use of their tool.
Try it now:
GO:0004674
GO:0016787
GO:0000086
GO:0000142
GO:0004520
GO:0004518
GO:0015074
GO:0061630
GO:0036292